Inhaltsverzeichnis Microsoft Excel 2016 Weiterführung
Inhaltsverzeichnis Microsoft Excel 2016 Weiterführung
1 Further Formulas and Functions
1.1 Errors in a worksheet
1.2 Text category
1.3 Date & Time category
1.4 Add-ins
1.5 Math & Trig category
1.6 Statistical category
1.7 Logical category
1.8 Lookup & Reference category
1.9 Financial category
1.10 Database funtions
1.11 Nested functions
1.12 Arrays
1.13 Exercise
1.14 Working with a lookup function
1.15 Protecting cells
1.16 Unprotecting documents
1.17 Protecting the workbook
1.18 Exercise 1
1.19 Exercise 2
1.20 Index function
1.21 Exercise
1.22 Custom number formats
1.23 Conditional formatting
1.24 Hyperlinks
2 Working with Data Lists
2.1 General information for creating a list
2.2 Complex sorting using a dialog box
3 Working with Data Validation
3.1 Setting data validation criteria
3.2 Checking already existing data
3.3 Extending data validation to other cells
4 Goal Seek
5 Consolidate
6 Scenario Manager
6.1 Task
6.2 Working with estimates
6.3 Opening the Scenario Manager
6.4 Creating a scenario report
6.5 Displaying and editing a scenario
6.6 Deleting a scenario
6.7 Exercise
7 Data Analysis Using Data Tables
7.1 Data table with one variable
7.2 Data table with two variables
8 Solver
8.1 An example of using the Solver tool
8.2 Exercises
9 PivotTable
9.1 What is a pivot table?
9.2 Creating a data list
9.3 PivotTable Tools
9.4 Creating the PivotTable report
9.5 Advanced pivot table features
9.6 Changing the pivot table
9.7 Rearranging rows and columns
9.8 Sorting and filtering
9.9 Grouping data
9.10 Displaying extreme values
9.11 Exercise
9.12 Changing the data source
9.13 Inserting a timeline
9.14 PowerPivot and PowerView
10 Turning a Range Into an Excel Table
10.1 Creating an Excel table in the default style
10.2 Changing the table style
10.3 Creating an Excel table using a style
10.4 Filtering using slicers
10.5 Deleting an Excel table
11 Outlining Excel Data
11.1 Sample worksheet
11.2 Showing and hiding cell ranges
11.3 Removing the outline
11.4 Customizing levels and ranges
11.5 Exercise
12 Conditional Sums and Subtotals
12.1 Conditional Sums
12.2 Exercise
12.3 Subtotals
13 Charts
13.1 Break-even analysis
13.2 Sparklines
13.3 Combo chart
13.4 Adding data series to charts
13.5 Scaling
13.6 Excercises
13.7 Changing the display unit of the value (y) axis
13.8 Exercise: car suspension
13.9 Exercises
13.10 Data labels
13.11 Creating a pivot chart
13.12 New chart types
14 Inserting Illustrations (Graphics, Pictures, etc.)
14.1 Inserting an online picture
14.2 Editing inserted pictures
14.3 Picture Tools
14.4 Adding pictures and objects to a chart
14.5 Exercise
14.6 Getting apps from the Office Store
15 Macros – Automating Tasks
15.1 Recording a macro
15.2 Running a macro
15.3 Opening a workbook with macros
15.4 Exercise
16 Creating a Custom Function
16.1 Procedures
16.2 Parts of custom functions
16.3 The Gross_amount custom function
16.4 Using the custom function
16.5 Exercise
17 Data Import and Export
17.1 Using the clipboard to exchange data
17.2 The Paste button
17.3 Cell references to other worksheets
17.4 External references
17.5 OLE and DDE
17.6 Object Linking and Embedding – OLE
17.7 Dynamic Data Exchange – DDE
17.8 Exercise
17.9 Preparing a document for sharing
18 Templates
18.1 The benefits of a template
18.2 Creating a template
18.3 Saving the template
18.4 Displaying custom templates on the File menu
18.5 Using the template for a new workbook
18.6 Changing the template
18.7 Exercise
19 Forms
19.1 Validation and cell protection
19.2 Controls
19.3 Formatting
19.4 Print
19.5 Exercise: scroll bar
20 OneDrive and Microsoft Office 2016 Online
20.1 Saving to the Cloud (OneDrive)
20.2 Microsoft Office 2016 Online
21 Sharing workbooks
21.1 Sharing the workbook in a network
21.2 Sharing via the cloud
21.3 Sharing a workbook in Excel Online
22 Collaboration using the SharePoint Server
22.1 Opening SharePoint
22.2 Editing documents that are not locked
22.3 Opening a worksheet, which is already in use, in Excel
22.4 Simulataneous editing of a workbook in a browser
22.5 Checking out and checking in of a file
22.6 Uploading documents to the SharePoint server
22.7 Synchronizing data
22.8 Exercises
23 Performing Settings in Excel
23.1 Options
23.2 Customizing the Quick Access Toolbar
24 Appendix: Solutions
25 Subject Index
Auszug aus den Schulungsunterlagen
Auszug aus den Schulungsunterlagen Microsoft Excel 2016 Weiterführung
Please note: the formattings of the following excerpt from our training material differs from the original document!
New chart types
Excel 2016 offers you six new chart types to visualize your data:
- Sunburst
- Treemap
- Waterfall
- Histogram
- Pareto chart
- Box & Whisker
Sunburst
Sunburst charts are used for displaying hierarchical data. Each hierarchical level (level of categories) is symbolized by a ring and arranged from the inside to the outside. Hence, the inner ring represents the top level. The chart shows how the rings are broken down into its components and how much the single categories and subcategories contribute to the total.
The following sunburst chart shows the sales of a clothing store split into categories.
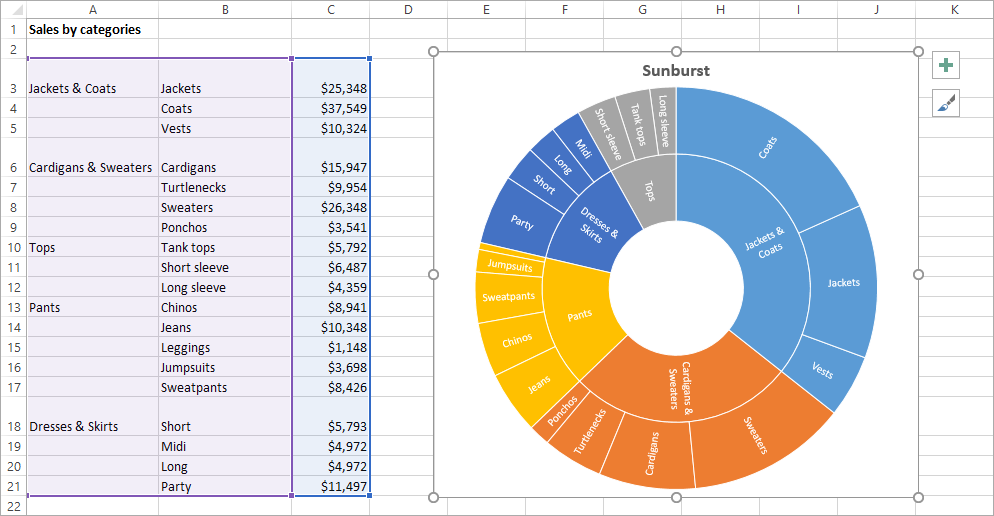
The chart illustrates that jackets and coats generate most sales and that coats are the best-selling products within this category.
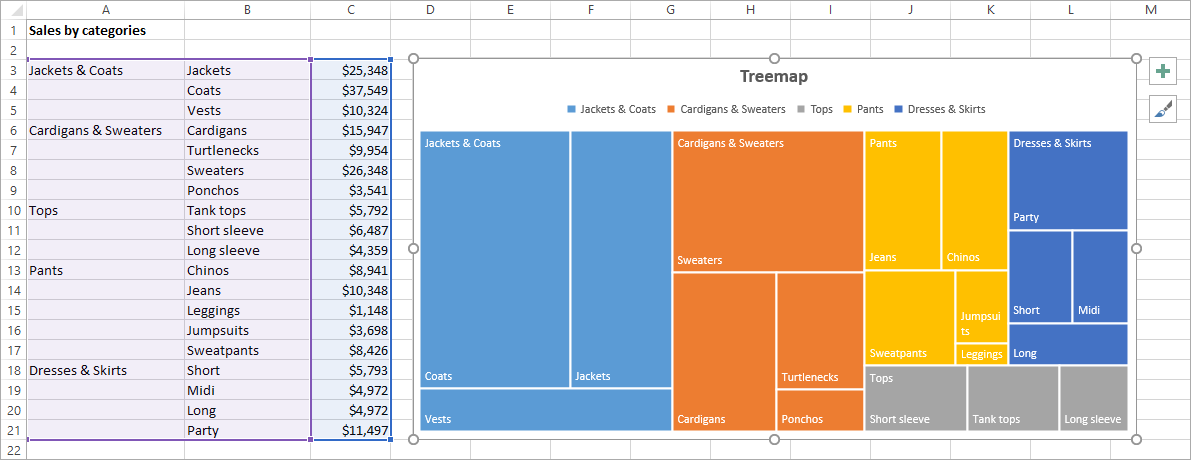
Treemap
Treemap charts are also used for displaying hierarchical data. Here, the single categories are represented by rectangles, subcategories by smaller rectangles within those rectangles. Hence, treemap charts are particularly suitable for comparing proportions within a category.
In the following example, we used the same data as for the sunburst chart:
Waterfall
Waterfall charts are special types of column charts that are used to display financial data. They illustrate how a series of positive and negative values increase or decrease an initial value and thus lead to the final value.
A typical example is the illustration of the net income which results from various deductions from the gross revenue:

Die englischsprachigen Lernunterlagen Excel 2016 für Fortgeschrittene zeigen alle Software-Vorteile auf und sind eine lohnenswerte Investition
Setzen Sie bei Aufgaben für eine Tabellenkalkulation auf Teamwork mit internationaler Sprachausrichtung, sind Excel und Englisch gewissermaßen Marktführer. Die englischsprachigen Schulungsunterlagen aus dem Dettmer-Verlag zum Thema Excel 2016 für Fortgeschrittene verschaffen Ihren Kursteilnehmern rasch umfangreiches Wissen.
Das Lernmaterial hilft bei der Suche nach Lösungsansätzen, die über das Grundwissen hinausgehen. Ihr weiterführender EDV-Kurs für Microsoft Excel 2016 gibt Einblick in die Datenanalyse mit Hilfe von Tabellen. Themen wie Zielwertsuche und Konsolidieren werden praxisbezogen vorgestellt, ebenso die Möglichkeiten mit Szenario-Manager und Solver. Ihre Teilnehmer lernen, mit Schätzdaten und „Was-wäre-wenn-Analysen“ zu arbeiten. Welche Vorteile stecken in Pivot-Tabellen? Die Kursunterlagen erläutern leicht nachvollziehbar Werkzeuge und Berichtserstellung. Jedes Kapitel ist mit interessanten Übungsaufgaben aus dem Arbeitsalltag verbunden.
Versierte Excel-Anwender profitieren vom sicheren Umgang mit Diagrammen sowie der Arbeit mit Makros und benutzerdefinierten Funktionen. Innerhalb von Microsoft Office ist Excel 2016 ein wichtiges Element im Zusammenspiel mit den anderen Bausteinen. Über DDE-Verbindungen (Dynamic Data Exchange) und OLE-Objekte (Object Linking and Embedding) verknüpfen Ihre Kursteilnehmer zukünftig Daten mit anderen Dateien. SharePoint Server, OneDrive und Cloudspeicher sind für Teamwork in Englisch und den schnellen Austausch im Netzwerk unentbehrlich.
Mit unseren weiterführenden Lernunterlagen für Office 2016 Englisch mit dem Fokus auf Excel sind zügige Fortschritte in Ihrer EDV-Schulung realisierbar. Aus dem von uns gelieferten Word-Format gestalten Sie mittels eigenem Design und Ergänzungen individuelles Lernmaterial für englischsprachige Teilnehmer. Die Ausgaben als Print-Exemplar oder via PDF im Firmen- oder Behörden-Intranet dienen über die Schulung hinaus als Wissensspeicher.
↓ Inhalt als PDF ← Alle Office 2016 Schulungsunterlagen in Englisch______________________________________________________________________________________________________________________________
Video: How to find and use new chart types in Excel with Office 2016 | Microsoft UK
https://www.youtube.com/watch?v=kDQJI4J-NBM